Thank you for exploring the National Weather Service NOAA NWS OSTI Air Quality Forecast Guidance. Most of the major controls and features of this web display are circled/numbered on the image below with details following.
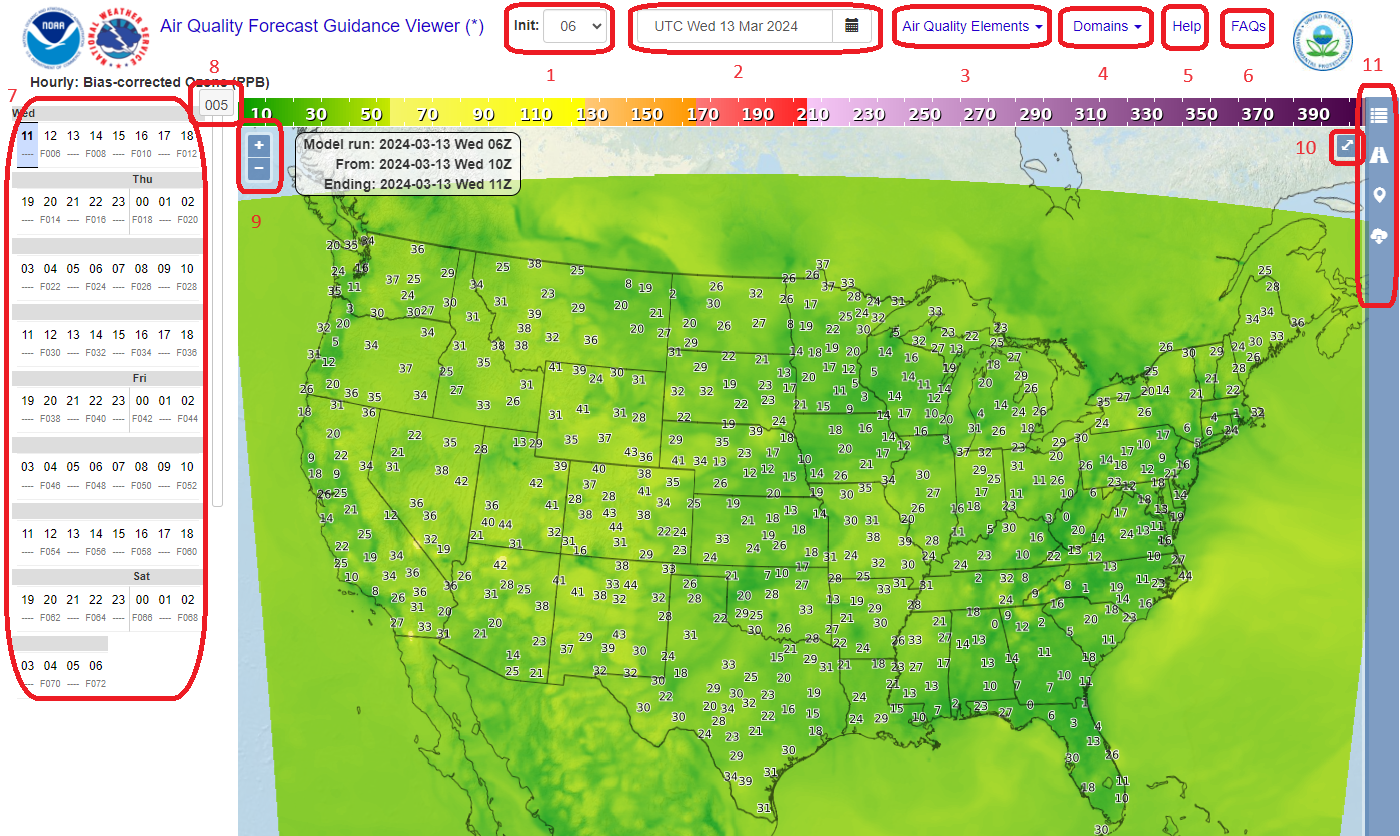
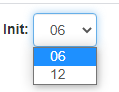
1 Forecast Guidance Cycle Time /
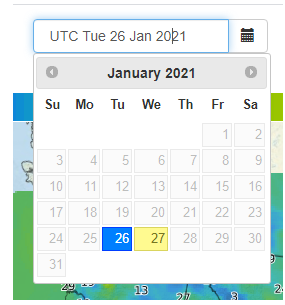
2 Forecast Guidance Date
This first drop down menu allows you to select the desired cycle time the forecast guidance is based from for the selected date.
Clicking on the date picker control will allow you to select a date where Air Quality forecast guidance is available.
|
|
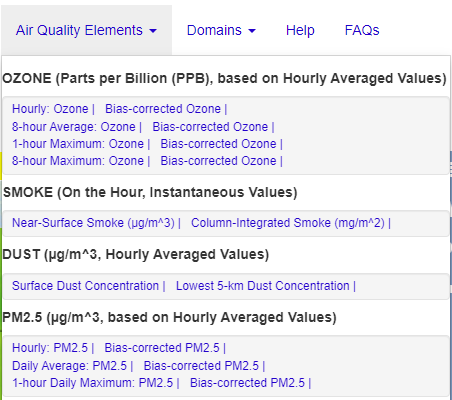
3 Air Quality Forecast Guidance element selection
Upon hovering the mouse pointer over the "Air Quality Elements" text, a menu appears with the current list of Air Quality Forecast Guidance elements. Clicking on one of these elements will display the forecast guidance images for that element over the map.
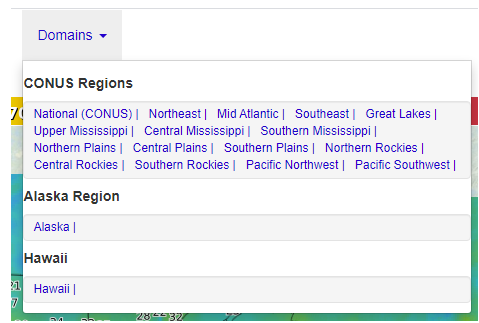
4 Domain selection
Upon hovering the mouse pointer over the "Domains" text, a menu appears with a list of geographic areas where Air Quality Forecat Guidance elements can be displayed. Under CONUS, several subdomains are also listed. Selecting one of these will zoom and pan the map to a central point within that subdomain.
5 Help Page
Upon clicking the mouse pointer over the "Help" text, this Help page appears.

6 FAQs Page
Upon clicking the mouse pointer over the "FAQs" text, the "Frequently Asked Questions" page appears.

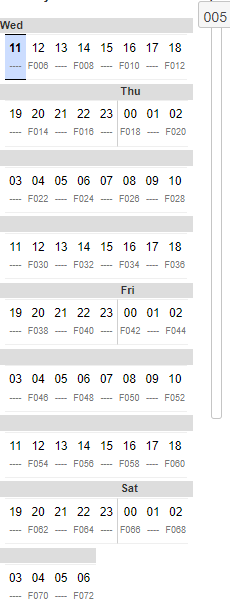
7 Air Quality Forecast Guidance projection hour/valid hour table /
8 Air Quality Forecast Guidance projection hour slider
This table lists the forecast hours from the cycle date/time and valid times for the selected element. Upon clicking on a projection hour/valid time, the image overlay of the element's forecast will change to match the selection. There is also an option discussed later which can change the selection option.
In addition to selection by the clicking on the projection hour/valid time, one can either click on the slider to the right of the table or click and hold the mouse on the slider tab (which displays the projection forecast hour within it) and move the slider up or down. In effect, moving the slider creates a looping capability through the forecast projection hours for the selected element.
9 Zoom/Pan Controls
When enabled in the options menu,, the "+" and "-" buttons in the upper left of the map display provide a way to zoom in and out on the map by clicking on them with the mouse.
Additionally, the zoom of the map can be controlled using the mouse scroll wheel or zooming in can be achieved by double clicking on the map where you wish to be zoomed and centered.

Panning the map is achieved by holding down the left mouse button when the cursor is over the map and moving the mouse. The map will pan to the area you're interested in until you release the mouse button.
10 Full screen control
In the upper right portion of the map, one can expand the display using the full screen control. Pressing on the Escape (esc or ESC) key on your keyboard will return you to your normal view.

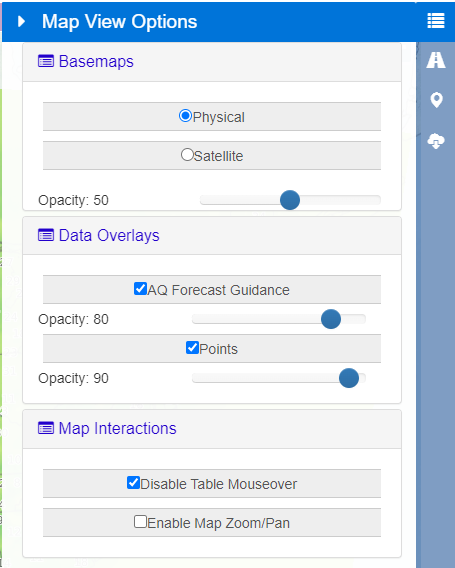
11 Options slide out panels
Clicking on the icons on the right side of the display will open different options panel for the display.
The first is Map View Options where one can select the background map, which data to display, and couple of different options to interact with the display. In addition, for map background and overlays, one can change the opacity of each. With map interactions, if one unchecks the "Disable Table Mouseover", hovering over the projection forecast hour table will select the hour the mouse pointer hovers on to change which hour is displayed. The slider moves accordingly as well. The second interaction enable the Zoom and Pan functions. This is disabled by default because zooming or panning too fast can overwhelm the backend image creation process and may cause the browser to lock up until all the image requests are complete. In addition, the page will scroll when a mouse wheel is enabled if the mouse pointer isn't over the map area.
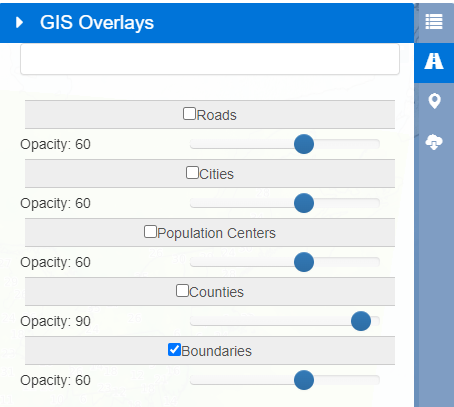
Clicking on the next icon will open the GIS Overlays options. These are geographic overlays to provide location or density references. When checked, one can change the opacity of these overlays to provide a fade in/out effect in conjunction with element displayed.
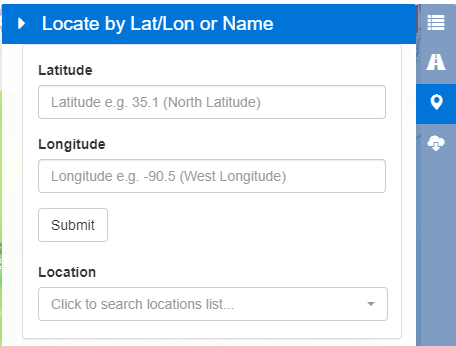
Clicking on the next icon will open a form where one can enter a latitude and longitude to display the point information popup described below. The form takes North latitudes and negative values of longitude for West longitudes. There is entry validation in place and popup alerts will indicate if you've entered incorrect values.
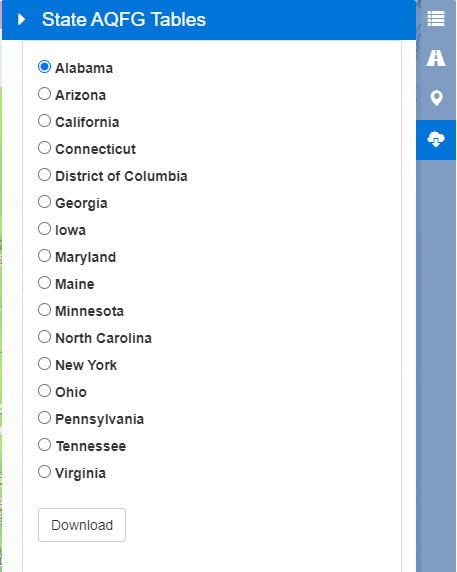
Clicking on the last icon will open a selection form from which one can download Air Quality Forecast Guidance tables which provide values at certain locations. These text tables are mostly for state air quality offices.
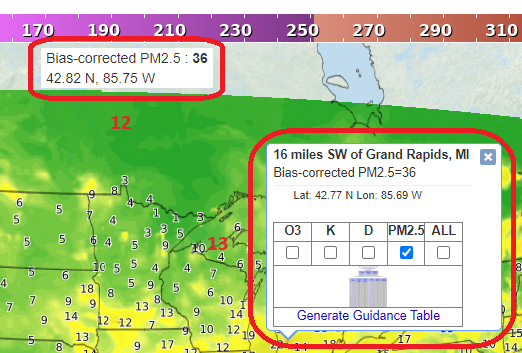
12 Mouseover readout display /
13 Point information popup
At the top of the map display is an element forecast guidance data value readout box that displays the value under the location of the mouse cursor on the map as well as latitude/longitude. This feature allows a quick view of the data values for the element and forecast date/time without clicking on the map. Note that this feature requires modern web browsers: the data readout will be absent if not supported by the browser.
Single clicking on the map will display a "Point Information" popup, which displays location information at the clicked point as well as the forecast guidance data value for the element and valid time selected. Advancing the time on the slider or forecast projection table updates the forecast guidance value as well as does changing the element. The box also has a row of checkboxes corresponding to each element category with the currented selected element category checked. Current categories: O3 for ozone, K for smoke, D for dust, and PM2.5 is self-explanatory. By clicking on the table icon or the "Generate Guidance Table" link, a separate window will open that first indicates the forecast guidance is being retrieved. Once all the requested data is retrieved, Air Quality forecast guidance value tables will be displayed for that point. Values for ozone and PM2.5 are color coded to match hazard levels which are described in the FAQs page. One can tailor these tables by either checking on different elements in the checkboxes or all of them by checking the "ALL" Checkbox.
Keyboard Shortcuts
To assist with quickly adjusting the forecast time step, the following key board shortcuts have been added:
left/right arrows: Shifts forecast time back/forward one time step
up/down arrows: Shifts forecast time up/down a row in the table